
Breaking News: Gold Loses Momentum After Record Highs, High-Level Tug-of-War Intensifies
1/16/2026
Investors, take note! Overnight, the gold market failed to deliver a fresh breakout. Instead, it staged a classic profit-taking tug-of-war between bulls and bears. After retreating from historic highs, gold prices have been locked in repeated back-and-forth trading within key ranges, as rising two-way battles keep investors firmly in wait-and-see mode.
Latest Market Snapshot — Key Data at a Glance
Spot gold pulls back but holds support:
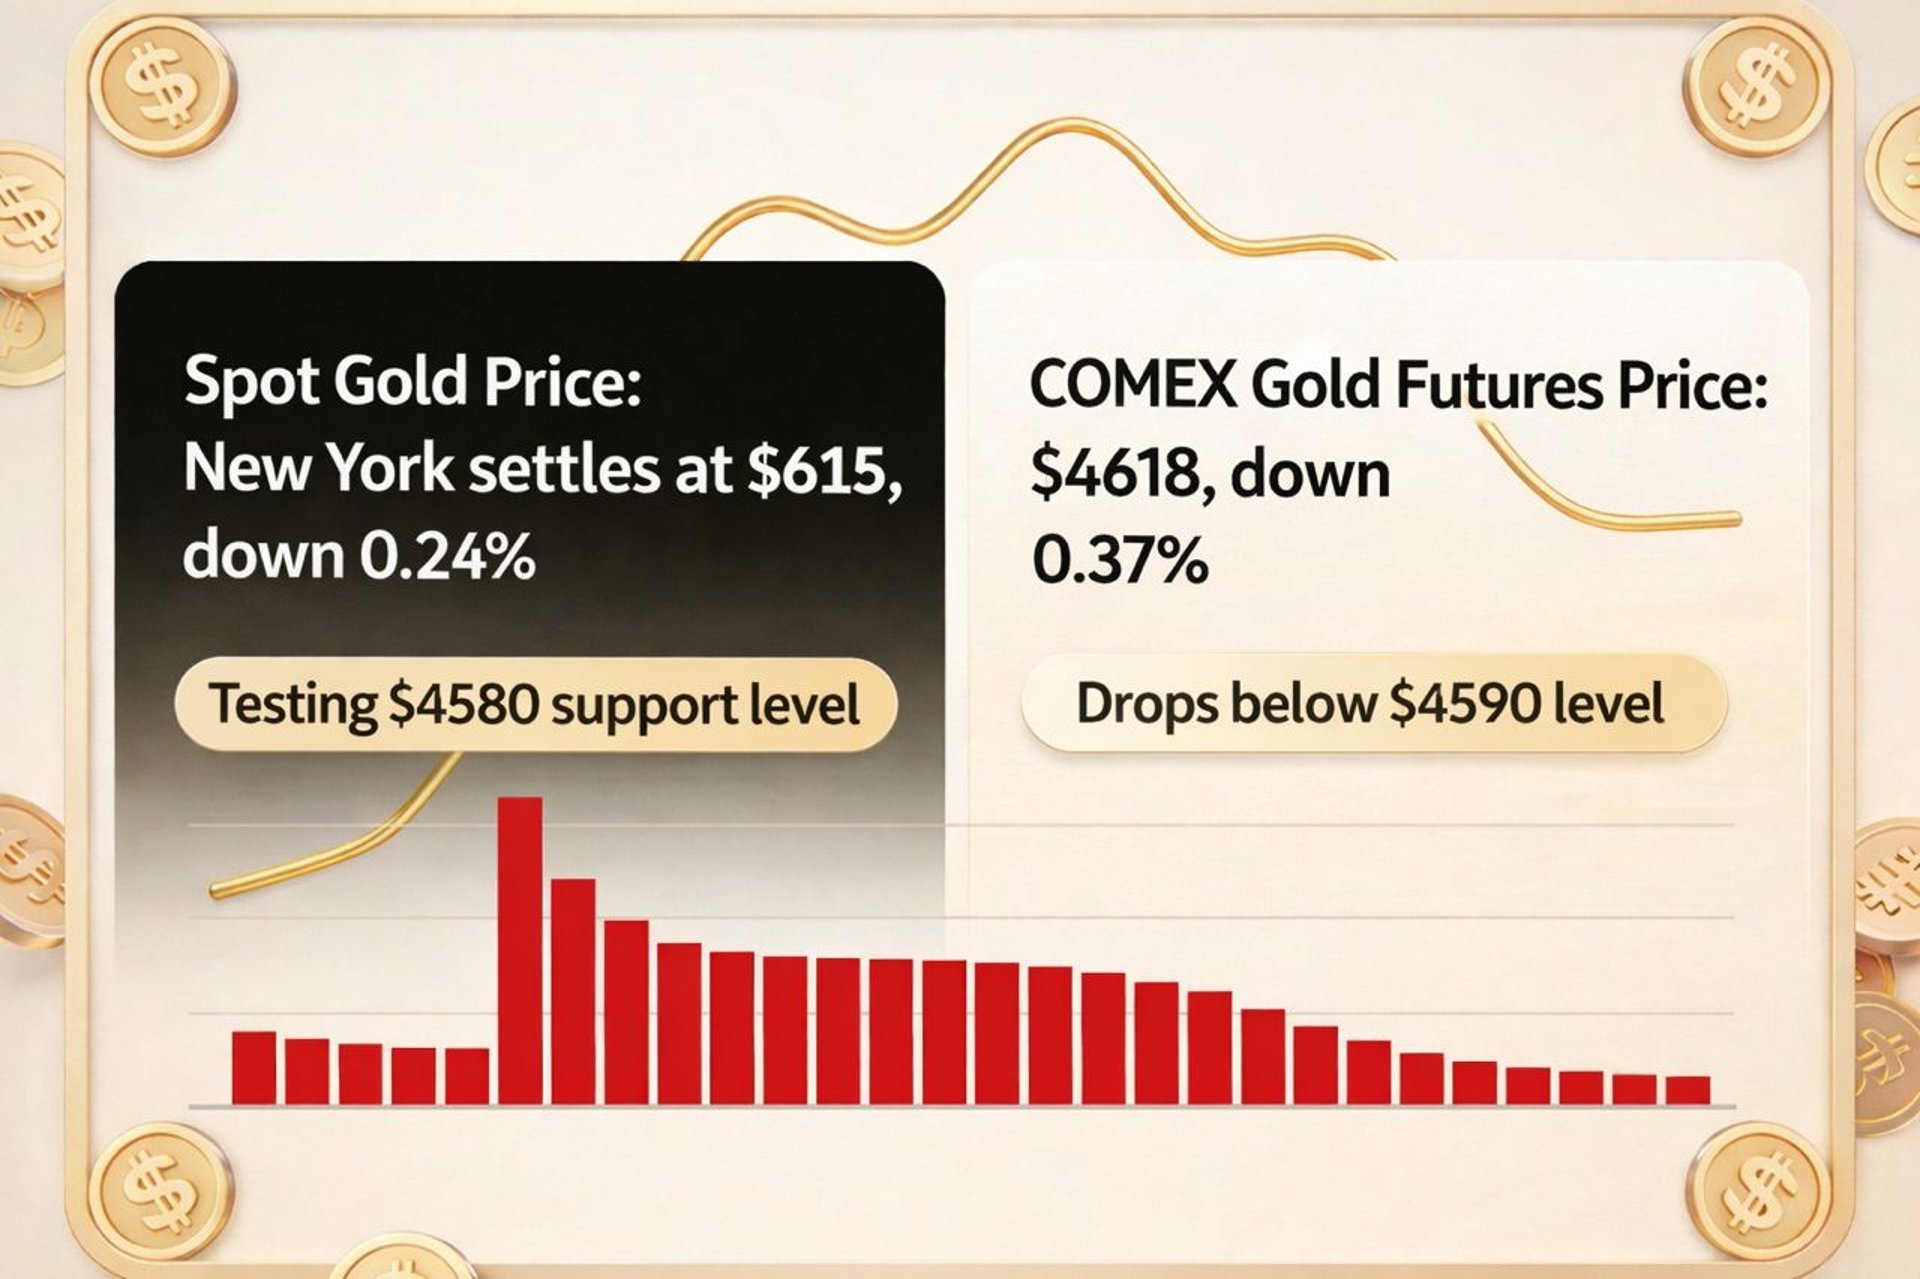
International spot gold retreated from recent record highs, slipping about 0.24% by the end of the New York session to around USD 4,615 per ounce. During trading, prices tested the USD 4,580 support level multiple times, but for now, the level has held, preventing a deeper correction.Futures also under pressure:
COMEX gold futures moved lower in tandem, falling roughly 0.37% to USD 4,618 per ounce. Prices briefly broke below the USD 4,590 level several times intraday before rebounding modestly to recover part of the losses, leaving the overall trend choppy and unstable.
Why Did Gold Suddenly “Lose Its Footing”? The Logic Is Straightforward
Gold’s short-term pullback is largely driven by overextended gains. Prices had risen too fast and too sharply, triggering clear technical overbought signals. As a result, many short-term traders chose to lock in profits, releasing concentrated selling pressure that weighed on prices.
At the same time, the U.S. Dollar Index staged a temporary rebound, while some geopolitical tensions showed marginal signs of easing. These two factors combined to place additional short-term pressure on gold.
🔁 Market Deep Dive: Short-Term Profit-Taking vs. Long-Term Bullish Trend
The market is currently experiencing a divided battle. On one side, short-term capital is rushing to exit; on the other, institutions remain firmly optimistic about gold’s long-term trajectory. The key difference lies in short-term volatility drivers versus long-term structural trends — the two logics coexist without contradiction.
Short-Term Headwinds (Key Drivers of the Pullback)
Technical profit-taking dominates
This is the primary driver of the current correction. In 2025, gold surged by roughly 65%, while silver jumped nearly 150%. After repeatedly setting new highs, technical overbought pressure accumulated rapidly, prompting short-term funds to take profits and generating temporary selling pressure.
Stronger dollar weighs on valuations
As the U.S. dollar strengthens, gold — priced in dollars — becomes more expensive for non-U.S. currency holders. This marginally reduces buying interest and suppresses demand, weighing on prices.
Cooling safe-haven demand
Market analysis suggests that some geopolitical risks have shown signs of easing, leading to a marginal decline in risk aversion. As a result, short-term demand for gold as a safe-haven asset has softened, weakening near-term support.
Long-Term Support Logic (Why the Bull Market Remains Intact)
Sustained central bank buying provides a strong floor
According to the World Gold Council, global central banks added nearly 1,200 tonnes of gold in 2025, with the buying trend continuing into early 2026. This persistent official-sector demand has created a solid long-term price floor — effectively a structural “safety cushion.”
De-dollarization and safe-haven logic remain unchanged
Analysts emphasize that the current gold bull market fundamentally reflects a repricing of fiat currency credibility, reinforced by rising global political uncertainty and accelerating de-dollarization. These core drivers remain intact, anchoring gold’s long-term upward trend.
Capital inflows continue to support prices
In 2025, net inflows into global gold ETFs reached USD 89 billion, pushing total assets under management to record highs. Continued allocation from both institutional and retail investors is providing ample liquidity support for gold’s long-term outlook.